Effect 19 Chart
Chart.js-powered data charts — bar, line, radar, polar area, pie and doughnut — with fine-grained animation, scale and tooltip options. Ideal for sales figures and statistics dashboards.
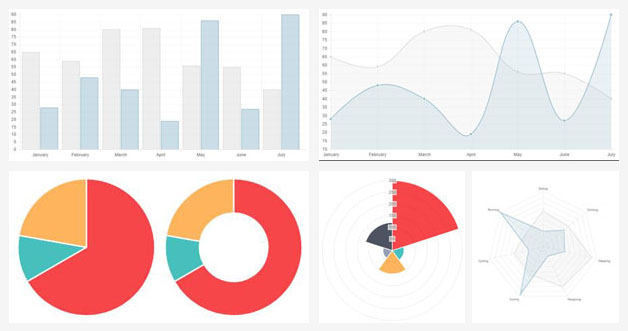
Live Demo
Visit the official demo page to see it in action.
Data Fields
| Field | Description |
|---|---|
| Data items | Each item is a dataset: label, value series, fill color, etc. |
| Group | Can be used for multi-series comparison |
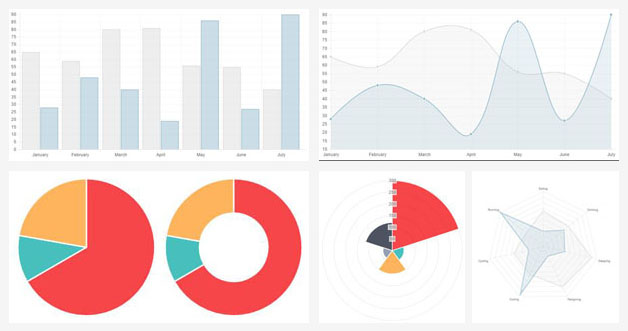
Item form (Field Manager) screenshot:
Effect Settings
Chart basics
| Parameter | Description |
|---|---|
| Labels | X-axis labels (comma separated, e.g. "January","February"...) |
| Chart Type | Bar / Line / Radar / PolarArea / Pie / Doughnut |
| Chart Width / Height | Width (default 800) / height (default 450) |
| Animation / Steps / Easing | Enable animation / steps (default 60) / easing |
| Responsive / Maintain Aspect Ratio | Responsive / keep aspect ratio |
Scale
| Parameter | Description |
|---|---|
| Show Scale / Show Labels | Show the scale / scale labels |
| Scale Override / Steps / Step Width / Start Value | Define the scale range manually |
| Scale Begin At Zero / Integers Only | Start at zero / integers only |
| Scale font | Scale font family, size and color |
Tooltips
| Parameter | Description |
|---|---|
| Show / Custom Tooltips | Show / custom tooltips |
| Tooltip FillColor / font | Tooltip background and fonts |
| Caret Size / Corner Radius / Offset | Caret size / corner radius / offset |
Per-type options
| Parameter | Description |
|---|---|
| Bar charts options | Bar spacing, strokes, etc. (9 options) |
| Line charts options | Bezier curves, point dots, etc. (14 options) |
| Radar charts options | Angle grid, point labels, etc. (15 options) |
| Area / Pie & Doughnut options | Segment strokes, inner cutout, rotate animation, etc. |
Related
- Effect Options — configure this effect's theme and parameters
- Effect Overview — all effects
- Adding Items — add items for this effect
- All Items — manage items